Canon 7Dii vs Nikon D750 Dynamic Range Test

As promised, here are the Dynamic Range Test Shots I took. I redid the entire test, with more cameras, including:

- Canon 7DII
- Canon 7D
- Canon 5Dii
- Canon 5Diii
- Canon 70D
- Sony A7s (Not Slog)
- Panasonic GH4
- Nikon D750

For each of the images I am clipping out the 1st step of the wedge, leaving the other 40 or so for analysis, this overexposure is recoverable in RAW files, so Ive also included a screen shot of what I am doing in Camera Raw with the sliders.

Let me know what feedback you guys might have on how I can improve it. https://www.hightail.com/download/UlRTaklncG9tMEpBSXNUQw

Best wishes

Michael
 
Upvote 0
Thanks for the upload.

I am still seeing uneven lighting, you have dramatic fall off after number 38.

I am not suggesting you are slanting the test to favour any camera, just that you have a methodology issue.

Also, I am not getting clipping on the first step, some are 245 ish, not 255, I don't see how you can lift exposure and shadows in post and expect even results either.

When I did similar tests on film and paper you had to take a series of images with different exposures and select the one that gave you a clipped step 1, then you can see where the darkest tone still is, without adjustments.

Otherwise you could do this, it is the 70D adjusted from your one shot to show clipped blacks only in step 41 and clipped whites only in step 1, or the full DR of the wedge!

I think that to demonstrate what you are trying to you need to make different exposures with each camera, you need to get the light even so all the step numbers are the same values (that is why they are like that), you need to compare the one exposure from each camera that clips step 1 then look at the shadows. If you run into screen DR limitations you need to look at brighter exposed images and count the difference in EV between them to arrive at the sensor DR capabilities.
 

Attachments

  • 5.jpg
    5.jpg
    438 KB · Views: 218
Upvote 0
A few comments-

The actual numbers on the the strip are all the same as step 1, with the exception of the last 3-4, these are different for some reason (the numbers themselves are actually darker- I do not know why). Number 41 is so dark, that without a special light, you cannot see it (it just looks black). 38, 39, 40 are increasingly dark as well. It might have something to do with the process the strip is meant to be used for. IDK.

The lighting set up positions were the same in all tests, double diffused, constant coverage and larger than the target area itself. I wouldn't know how to get it more even than it is.

This second time around, because there were so many cameras involved, there were some micro adjustments required on the light power itself, especially the GH4, who's iso only goes down to 200, not 100, so that had to be adjusted to compensate for the ISO change.

Still, my thought is clipping out the 1st step on every camera (which you can see it with highlight alert), that would be a calibration point for the rest of the 40 steps. Importing RAW files, obviously this is recoverable, which means there is still some head room and why I don't think it is a good test for total DR. Also, there were no strobe power adjustment changes between the D750 and 5Diii, and that wouldn't explain the differences in performance there.

I tried bracketing, the problem there becomes that we are using a 13.7 EV strip, once you burn off 4-5 stops, you only have 8-9 to analyze, so I my goal was to squeeze it down to the first step as a way to try to calibrate each cameras start point for the test.

Ultimately, I think the way to do it is with a 15-20 stop strip, but the only test I know of that works in that range is $3,500.

I appreciate the comments and feedback. Im listening. Im learning that I need work on how I present my methodology as well as why I did the test a certain way.
 

Attachments

  • Canon-70D.png
    Canon-70D.png
    2.2 MB · Views: 193
  • Nikon-D750.png
    Nikon-D750.png
    1,023.2 KB · Views: 322
Upvote 0
Michael, I checked you files with RawDigger and even the first step seems to be quite a bit lower than clipped on more or less all your files. Raw converters give highlight warnings when the converted jpg clips, not when the rawfile clips so there is often much more highlight headroom in the rawfiles than one would think.

In order to get better control over the potentional of your raw files, you may be interested in checking out RawDigger at (free 30day trial):
http://www.rawdigger.com/
 
Upvote 0
MichaelTheMaven said:
I appreciate the comments and feedback.

As a secondary observation: Watching not only for the borders between steps, but even on clearly delineated steps for color uniformity is interesting - if it gets too colorful here on should netter expect either a similar effect or heavyhanded noise reduction on areas in the same zone of production pictures.
 
Upvote 0
Lawliet said:
MichaelTheMaven said:
I appreciate the comments and feedback.

As a secondary observation: Watching not only for the borders between steps, but even on clearly delineated steps for color uniformity is interesting - if it gets too colorful here on should netter expect either a similar effect or heavyhanded noise reduction on areas in the same zone of production pictures.

This is very excellent input. (about the actual tones from 2 side-by side swatches) I wonder what a good way to determine specifically at what point that happens. Some of the swatches look identical to me in the mid 20's, but it does seem there is a point that noise kinda starts messing everything up after a certain point.

Another thing you guys helped me realize, is that the exposure slider amount (which is in EV) to the point at which the first step clips out, minus that one step of over exposure, might be useable to calculate total DR. There is some headroom on the bright end, and if we are clipping out the first step, wouldn't it be the amount we moved that slider over in camera raw? Almost seems too obvious to be believable.
 
Upvote 0
I just thought I would share some info on the raw files Micheal shared. I decided to load them up in PixInsight. PixInsight is an astrophotography processing tool, and it is extremely powerful. It has amazing tools, many for noise reduction. It also has a statistics module as well. The cool thing about PI is you can operate on your images in linear space (without any additional processing applied, so it's "pure", untainted data that has not been affected by RAW editor tone curves or anything like that.) It is also capable of processing data in a wide variety of numerical spaces, including 8/10/12/14/16-bit integer, 32-bit float as well as 64-bit float. So, it makes for a nice platform for analyzing data in an objective manner.


To that end, here is some data I was able to generate using PI's statistics module in linear mode, with the original images without any edits, as well as some after various attempts at noise reduction. I used a PixInsight feature, Previews, to cordon off certain regions of each image and perform statistics on. Most of the statistics I'll be providing will have a name in the form of <imageFile> -> <previewName>, just so you know what your looking at.


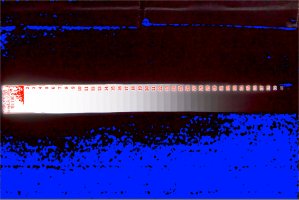
First off, the linear images, when opened up in PI, definitely show that swatch 1 was not anywhere close to the clipping point, in either image. Here are a couple crops showing just the strip, as rendered by default in PI's linear mode, along with statistical details from swatch #1:


5DIII
op4s8IL.jpg


_3H7C0105->Preview04
Data Point R G B
count (%) 100.0000 100.0000 100.0000
count (px) 63784 63784 63784
mean 166.227 154.809 177.034
median 165.973 154.607 176.774
variance 46.421 31.791 38.432
stdDev 6.813 5.638 6.199
avgDev 7.068 5.867 6.444
MAD 7.609 6.328 6.951
minimum 135.272 131.047 147.743
maximum 191.163 175.872 201.148


D750
pHlETaI.jpg


DSC_1424->Preview06
Data Point R G B
count (%) 100.0000 100.0000 100.0000
count (px) 62748 62748 62748
mean 191.694 172.764 185.102
median 189.837 171.012 183.233
variance 58.980 43.680 44.843
stdDev 7.680 6.609 6.696
avgDev 7.971 6.870 6.953
MAD 8.065 6.738 6.738
minimum 176.241 158.728 167.611
maximum 218.949 194.171 205.922


The statistics are for each color channel, so R,G, B. As you can see from the maximum data point, the white level, it barely topped 200 levels (8-bit), meaning there was really a TON of headroom left on each sensor. This explains why the swatches became indiscernible from each somewhere between swatch 17 and 22, when I expected them to remain visible beyond that.

To clarify what's going on here. I know that swatch 1 appeared to be "clipped" to Michael. Both the cameras themselves, and any RAW editor he would have used, would have shown the white swatch #1 to be nearly or actually pure white because of tone curves. PixInsight does not apply any kind of curve unless I tell it to, so the images I've shared above are truly, 100% linear space.

As a side note...you should notice that the D750 crop is more reddish, and appears a bit brighter. It seems the red channel is slightly brighter in this image. I am not sure why, possibly a difference in white balance. The D750 image is indeed exposed a little bit more than the 5D III image. Again, if you look at the maximum statistic, you can see that there is a difference of ~30 levels in red, ~20 levels green, ~5 levels blue. Such a discrepancy should be eliminated for the most objective test results. I would say that swatch #1 should be clipped, all levels should be 255, 255, 255. Swatch 2 should be as close as possible to clipping without actually clipping in any channel, and the channels should deviate as minimally as possible (both across channels and across cameras...so if you get something like 250, 250, 250 +/- 3 in both cameras, that should suffice.)


This may be an opportunity to further explain, with a visual backup, something I've tried to explain in the past about shadow pushing. Note how much of each swatch, regardless of whether it is the 5D III or D750, is black? I don't just mean dark, but black. To my eyes, with my screen brightness turned up to maximum, in linear space, I could not differentiate any swatches from 22 through 41 for the D750, and I could not differentiate swatches 17 through 41 for the 5D III. That means that, in the case of both cameras, half or more of the dynamic range by default renders as black on screen. It isn't actually black, as you'll see in a moment here when I "stretch" the data, there is a lot of tonal detail in those "black" swatches that are most definitely not black. It just looks black. That is why we push shadows.

(Caveat: Since the highlight swatches were underexposed, once properly lit I suspect that the "indistinguishable from black" zone would shift down to swatches 25-29 or around there...however even in that case, one solid third of the tonal range available in the Stouffer T4110 step wedge shows up black by default, and this some of it (not necessarily all of it) would need to be pushed in order to contribute usefully to the final photograph...and this is even more true with a standard S-type contrast curve applied...that would again darken some of those swatches, maybe bringing the range back to somewhere between 22-25.)


Anyway, moving on. The next set of statistics are from the same linear images as shown above. Only in this case, the statistics are from swatch 41. There are two interesting things I glean from these statistics: noise levels and maximum level. I've also included a couple more images. These images demonstrate PixInsights "screen stretch" function, which applies a default MTF stretch curve to bring up the deep tones. The white swatches get blown, however screen stretch is normally intended for use with astro images, which pretty much don't have "whites"...almost all the data in an astro image falls into swatches 39-41. :P Anyway, the screen stretch aims to bring up the darkest tones to a common level, and it is fully automated (in other words, I did not do anything personally to bias the results), so it is a good visual indication of the differences between each camera.


5D III
cej879q.jpg


_3H7C0105->Preview01
R G B
count (%) 92.3782 95.3265 91.3499
count (px) 18956 19561 18745
mean 0.282 0.178 0.170
median 0.261 0.167 0.163
variance 0.026 0.007 0.010
stdDev 0.163 0.085 0.100
avgDev 0.160 0.081 0.098
MAD 0.156 0.081 0.098
minimum 0.008 0.008 0.004

maximum 1.268 0.642 0.825


D750
rEQrgzc.jpg


DSC_1424->Preview01
R G B
count (%) 100.0000 100.0000 100.0000
count (px) 23896 23896 23896
mean 19.070 9.470 10.899
median 19.074 9.471 10.899
variance 0.001 0.000 0.001
stdDev 0.038 0.019 0.023
avgDev 0.037 0.019 0.021
MAD 0.035 0.012 0.017
minimum 18.895 9.370 10.794

maximum 19.241 9.572 11.027


So, first statistic, maximum. There is clearly a large difference between the two cameras here. At this level, despite the D750 being slightly more exposed than the 5D III, a difference in maximum level of 10-20 levels is FAR more meaningful than a difference of 20-30 levels in the highlights. I honestly do not know if this is simply because the D750 has more dynamic range or not. Whatever the cause, the difference in maximum level between the 5D III and D750 here is massive. More massive than I would have assumed given the exposure levels of both cameras. I would be very, very interested in seeing what changes here if the exposures were fixed (i.e. Step 1 fully clipped, step 2 close to but not actually clipped.) I suspect the 5D III maximum level would increase, but so would the D750 maximum level. Would they deviate even more? Interesting stuff. (Michael, do you think you could rerun the D750, 5D III, and 7D II step wedge tests to correct the exposures?)


Second statistic, stdDev. This is the noise level, the standard deviation from the mean. It is about an order of magnitude difference in the green channel, more than an order of magnitude difference in the red and blue channels. I think the numbers speak for themselves...the D750 has significantly lower noise than the 5D III. I don't think anyone should be surprised by that...however I do think it is quite telling, as it can explain why the D750 steps from 35-41 look so clean...there is very low noise.


As far as the darkest steps with a discernible edge. With the screen stretch, I can see an edge between 35/36 on the 5D III, and I can see an edge between 37/38 on the D750. Because I was curious, I threw in some previews on swatch 41 of the stretched versions of both images, and here are the stdDev and maximums for each:


5D III
_3H7C0105_clone->Preview01
mean 59.503 59.127 55.742
median 59.735 58.634 56.661
variance 699.516 478.584 642.829
stdDev 26.448 21.877 25.354
maximum 152.770 136.280 150.739


D750
DSC_1424_clone->Preview01
mean 58.039 54.884 54.096
median 58.082 54.366 53.284
stdDev 11.211 6.536 6.822
maximum 97.654 84.568 87.623


Again, I think the statistics speak for themselves. Very similar mean/median values for both swatches (screen stretch aims to achieve a normative result, so we should expect that both images would have the same mean), big difference in stdDev and maximums (the higher stdDev of the 5D III ultimately pushes the brightest pixels brighter than on the D750...that IS what noise is, the deviation around the mean, and the larger the deviation, the brighter the brightest pixels will be.)


Finally, I ran some noise reduction on both sets of images. PixInsight has some phenomenal NR tools. One of my favorite is TGVDenoise. This is a Total Generalized Variation algorithm, and makes use of a slightly different kind of math to effectively wipe out noise entirely to a certain frequency, while generally leaving lower frequencies untouched. It is very good at removing per-pixel noise frequencies, without affecting lower frequencies at all.

I've applied TGVDenoise to the two images below, then stretched them with a screen stretch so you could see the results:


5D III
Zwp0h3z.jpg


D750
Iyq2ix6.jpg


TGV is configured according to the statistics of each image. I used the same settings for both images, with the exception of the Edge Protection setting, which I configured according to the stdDev statistic. By doing this, the same frequencies of noise are removed from each image, leaving behind the rest. I believe the results are once again pretty self explanatory. Aside from the vertical banding, there is clearly some other level of lower frequency noise present in the 5D III image. I personally refer to this as color blotchiness. Even despite the complete obliteration of high frequency noise, it doesn't really change things for the 5D III...the color noise is still very intrusive.


For a little bit of subjective opinion, as far as the first swatch where noise becomes unacceptably intrusive, without any NR, I wold say swatch 25 on the 5D III. On the D750, it isn't particularly objectionable to me all the way to swatch 41, but if I had to pick an eminently usable cutoff point, I'd say around swatch 32 or 33. With NR, I would say swatch 27 on the 5D III, and swatch 37 on the D750.


One final thing. I thought it would be useful to show an example of what I think a properly exposed step wedge should look like rendered as unprocessed linear data. Michael, if you do generate some additional images, I think you should aim for something like this:


turlHi4.jpg
 
Upvote 0
jrista said:
To clarify what's going on here. I know that swatch 1 appeared to be "clipped" to Michael. Both the cameras themselves, and any RAW editor he would have used, would have shown the white swatch #1 to be nearly or actually pure white because of tone curves. PixInsight does not apply any kind of curve unless I tell it to, so the images I've shared above are truly, 100% linear space.

I had already read about "linear in the Photomatrix help as they've got a checkbox "import linear source file" and say that this doesn't apply to converted raw files. I admit I didn't really understand it, but I take it this means that setting the tone curve to "linear" in ACR/Lightroom still applies processing? How's that - behind the scenes or with the calibration profiles?
 
Upvote 0
Marsu42 said:
jrista said:
To clarify what's going on here. I know that swatch 1 appeared to be "clipped" to Michael. Both the cameras themselves, and any RAW editor he would have used, would have shown the white swatch #1 to be nearly or actually pure white because of tone curves. PixInsight does not apply any kind of curve unless I tell it to, so the images I've shared above are truly, 100% linear space.

I had already read about "linear in the Photomatrix help as they've got a checkbox "import linear source file" and say that this doesn't apply to converted raw files. I admit I didn't really understand it, but I take it this means that setting the tone curve to "linear" in ACR/Lightroom still applies processing? How's that - behind the scenes or with the calibration profiles?


Most RAW editors apply a default set of tone curves. In the case of ACR/LR, yes, it's the calibration profiles. A "linear" tone curve applied to any RAW image opened in ACR/LR is still going to have those base calibration profile curves applied, as they are (as far as I know) applied as part of the demosaicing process. When I used Aperture in the past, it was pretty much the same thing, as does RawThearapy. I think DarkTable may have a linear mode...haven't used that much.


The only tools that I know that will open RAW files in true linear space are PixInsight, and a free astro editor called Iris. Iris is ok, very limited. PixInsight is by far the best linear space editing tool I've ever come across.
 
Upvote 0
From Thom Hogan, a Nikon supporter for decades...

http://www.dslrbodies.com/newsviews/do-you-believe-in-dxomark.html

"...The DxOMark Overall Score is one of those faux statistics that attempt to put a lot of test data together with a lot of assumptions and come up with a single representative numeric value....

I’ve written before how the digital camera world has basically followed the old high fidelity world in terms of numbers-oriented marketing and testing. Back in the 70’s and 80’s people got crazy about frequency or power ratings for high fi gear. Yet in the long run, people who listened to the products found that slavish devotion to buying better numbers didn’t actually get them “better sound.” ...

It’s interesting to note that DxO seems to be playing a lot of angles. First, they are presenting themselves as impartial, numeric oriented testers (e.g. the scores). Second, they are presenting themselves as reviewers (e.g. "If Canon could only address performance at base and low ISO, the EOS 7D Mk II would make a thoroughly convincing all-round choice, but in this category the Sony A77 II looks to be the more compelling option."). Third, they sell their test equipment and software test suites to camera companies (Nikon, for instance, but I don’t believe Canon is one of their clients). Fourth, they present themselves as the best demosaic option, better than the camera makers’ options (e.g., DxO Optics Pro). They have some clear conflicts of interests that are not easily resolved. So be careful of just gobbling up their “results” as absolutes...

Even though those DxO-reported numbers aren’t what I’d expect in my images, they do tell me something: I might be able to dig more shadow detail out of the D7100 image than the 7DII image at base ISO, all else equal. That’s actually no surprise. This has been true of the Sony versus Canon sensor difference for quite some time now. If you’re a big fan of cranking the Lightroom Shadow slider to max, you’re going to be doing more noise correction on a Canon than a Nikon. Nothing’s changed here. However I’d point out that neither camera is likely to be able to hold extreme landscape situations in a single exposure: I’d still be bracketing and applying HDR type techniques to construct images in such cases. Thus, whatever the actual numeric difference in dynamic range between the 7DII and D7100 is at base ISO, it really wouldn’t make much of a difference to my workflow. I might adjust my bracket sets on the Canon to be a bit different than the Nikon to account for the difference in how they handle shadows, but that’s it. Bottom line, I’d get the same image."
 
Upvote 0
Jrista- hey I wanted to thank you for taking the time to put that all together, I really appreciate it. Your comments and several others have really helped me with presenting this information in a much cleaner way.

Im a bit short on time right now, but I will do more DR tests in the future.

I have taken many different exposures (bracketed) and what happens is when clip out in the RAW file as it is opened, I don't have enough swatches on the strip to get a good reading.

Additionally, even at the same exposure settings and flash power, some cameras still exposure slightly differently, I see it all the time in side by side shooting.

I am very curious about the software you mention, is anything you are aware of that can measure the signal to noise ratio of a specific swatch? Maybe cropped? I have some ideas, but it would be easier to measure a specific swatch.

Im still curious if it would be reasonable to add the total Exposure Slider value (in this case 2.0) if my me more serves me correctly, to the swatch reading (lets say 32-33, would be 10.67EV, or 12.67 ev, minus the one over exposed swatch, for a total of 12.33EV.? If we could precisely measure the signal to noise ratio threshold on both swatches instead of eyeballing it, it could very well be a cheap and easy way to at least estimate the ball park DR.

BTW- the Epic Shootout on the D750 and 5Diii posted last night, thought I would share it with you here. Again, thank you guys for your help in clarifying what / how I was presenting it.

http://youtu.be/EsZtUZvoeO0
 
Upvote 0
MichaelTheMaven said:
Jrista- hey I wanted to thank you for taking the time to put that all together, I really appreciate it. Your comments and several others have really helped me with presenting this information in a much cleaner way.


You are very welcome.

MichaelTheMaven said:
I have taken many different exposures (bracketed) and what happens is when clip out in the RAW file as it is opened, I don't have enough swatches on the strip to get a good reading.

Additionally, even at the same exposure settings and flash power, some cameras still exposure slightly differently, I see it all the time in side by side shooting.


When you say "get a good reading"...with what?

MichaelTheMaven said:
I am very curious about the software you mention, is anything you are aware of that can measure the signal to noise ratio of a specific swatch? Maybe cropped? I have some ideas, but it would be easier to measure a specific swatch.


I was measuring on specific swatches. What I did in PixInsight is draw previews around the center part of individual swatches. In the Statistics tool, I can select any one of those previews, and get SNR and other details just for that one swatch. It's very useful.


MichaelTheMaven said:
Im still curious if it would be reasonable to add the total Exposure Slider value (in this case 2.0) if my me more serves me correctly, to the swatch reading (lets say 32-33, would be 10.67EV, or 12.67 ev, minus the one over exposed swatch, for a total of 12.33EV.? If we could precisely measure the signal to noise ratio threshold on both swatches instead of eyeballing it, it could very well be a cheap and easy way to at least estimate the ball park DR.


I would need to know more about how your getting the DR readings. Adding exposure is not the right way...that is a modification after the fact, so you are not getting a valid DR reading of the camera. You really do need to expose Swatch #1 up to the point of clipping (maybe not fully clipped, but just to the point where it begins to clip). Otherwise, you are throwing away dynamic range, and more darker swatches will be buried in the read noise.


If your underexposing swatch 1...and, based on my analysis, your currently underexposing it A LOT, I mean, a LOT LOT, way too much since the levels are ~200 in 8-bit, which means you are throwing away ~55 levels, or over 21% of the signal space. Your throwing away DR. Or in other words, you are not actually measuring the full dynamic range of the sensor.


The key here is to expose as close to the limit as possible, so that fewer dark swatches become "dominated by noise", or close to that 1:1 SNR, where it doesn't really matter how much NR you do (and, I spent a lot of time trying to figure out a way of recovering the noise-ridden swatches from the 5D III image, the ones where you couldn't see the seam between swatches...there simply isn't any way as far as I can tell...nothing in PixInsight and none of my NR tools in PS, including Topaz and Nik...could recover anything useful below, what was it, swatch 35?)


I don't think that is going to change the results. Not much. The 5D III may gain one swatch on the D750...but the D750, which already demonstrates great performance right down to swatch 41, is going to get better as well once you push swatch 1 to clipping.
 
Upvote 0
When you say "get a good reading"...with what?

For example, if I clip out on the D750 in RAW, the swatch itself only has another 13.3 stops left to analyze. If a cameras DR is 14 or more, we wouldn't be able to see it because of the limit of the strip.

When you suggest clipping out that first swatch, what that means is there won't be enough room on the remaining part of it. They don't make a strip with anything more. Ill think about this. 4 stop ND filter in front of a portion of it perhaps?

Ill have to check out that software in that case. Thank you again!
 
Upvote 0
MichaelTheMaven said:
When you say "get a good reading"...with what?

For example, if I clip out on the D750 in RAW, the swatch itself only has another 13.3 stops left to analyze. If a cameras DR is 14 or more, we wouldn't be able to see it because of the limit of the strip.


That's ok. I understand the limitations of the Souffer strip. What I am saying is, if you do not...overexpose, swatch 1, then your not actually able to measure the true DR of the camera. Tight now, swatch one is being exposed about 21% or more below the point where it "clips out" (see below...I think there is just a misunderstanding of this term). If the D750 has, what, 13.8 stops, then at best, if we got the necessary statistics (which I think we have, I'll have to see about actually calculating the DR for real), then I would say at best, the data would show only around 11 stops for the D750, and maybe 9 stops at best, if that, for the 5D III. Because the highlight levels stop 21% below the digital clipping point...levels 201 through 255 are not being used...so your effectively throwing them away in your test.


Does that make sense? I can try to think of a better way of explaining...

MichaelTheMaven said:
When you suggest clipping out that first swatch, what that means is there won't be enough room on the remaining part of it. They don't make a strip with anything more. Ill think about this. 4 stop ND filter in front of a portion of it perhaps?


No, I think your just misunderstanding, and that is probably my fault for not explaining properly. I don't mean actually, say with scissors, "clip" off any part of the chart. :P I mean, expose it enough that the digital values "clip"...in this context, the word clip means that you have exposed enough that the highlight values in swatch one need to be say 257, 258, 260...but the numeric space only allows you to go up to 255. When you need numbers that are outside of the available numeric space, the technical term for what happens to them, they end up being the maximum allowed value of 255 instead of 257, 258, 260, is that those values are "clipped". It's a virtual thing, a numbers and math thing, not a physical thing. :P


I will see if I can demonstrate better when I get home. Basically, right now, your not using all of the strip. I'm trying to say, there is more room (digitally, in terms of number space, not anything physical) on the strip than you are using so far, because your not 'clipping' (or ever so slightly over-exposing) swatch 1. I don't mean you have to clip it heavily...you just need to get the levels in that swatch to say between 253-255 (and some will probably be brighter than that, hence why they are "clipped"). Once you get to that point, then you will fully be utilizing the entire strip properly.
 
Upvote 0
Im glad someone finally realizes that it isn't quite as straightforward as it should be. Ultimately, the ideal solution would be to have a 15 stop strip. My understanding of what I am doing now, is yes, I am throwing away the first part of the DR test because we pretty much know what it should look like, an over exposed first step, a few not over exposed and so on, and what we are doing is looking at the last 80% or so of it to try to measure its end performance. (We are throwing away about 2 stops if we are going the slider route, which I see you do not agree with).

Im all ears if you think there is a way we can do it better than this.

Thank you for your time
 
Upvote 0
MichaelTheMaven said:
Im glad someone finally realizes that it isn't quite as straightforward as it should be. Ultimately, the ideal solution would be to have a 15 stop strip. My understanding of what I am doing now, is yes, I am throwing away the first part of the DR test because we pretty much know what it should look like, an over exposed first step, a few not over exposed and so on, and what we are doing is looking at the last 80% or so of it to try to measure its end performance. (We are throwing away about 2 stops if we are going the slider route, which I see you do not agree with).

Im all ears if you think there is a way we can do it better than this.

Thank you for your time

As I see it it's not about "throwing away". To calibrate the exposure the first strip needs to show up as fully saturated in all colour channels (R=255, G=255, B=255) - this is what's called clipping.
 
Upvote 0
Looks like we will disagree on this. It is kinda hard to measure supposedly 14.5 stops of DR on a 13.7 strip, with really 13.3 EV to work with. The way I see it, the slider does allow us to recalibrate the analysis, clipping the first point off starting from 2 stops in, Id love to understand why that is an unreasonable assumption. Add that two stops back in after the calculation and both cameras are well within the ballpark of much more expensive methods.

Again, if you have a better suggestion I am all ears.
 
Upvote 0
MichaelTheMaven said:
Looks like we will disagree on this. It is kinda hard to measure supposedly 14.5 stops of DR on a 13.7 strip, with really 13.3 EV to work with. The way I see it, the slider does allow us to recalibrate the analysis, clipping the first point off starting from 2 stops in, Id love to understand why that is an unreasonable assumption. Add that two stops back in after the calculation and both cameras are well within the ballpark of much more expensive methods.

Again, if you have a better suggestion I am all ears.


It is not a disagreement, Michael. I don't mean to be rude, so with all due respect, you are misunderstanding how to use the strip. You don't need 14.5 stops, because you are not even making full use of the 13.7 stops the strip you have now currently offers. Until you clip swatch 1, you are under-utilizing the Souffer 4110 Wedge. It isn't a matter of opinion here, it is a matter of proper application. It is necessary to clip that first stop. The rest is a simple matter of mathematics.


I checked out the statistics in PI, calibrated to 14-bit. In 14-bit number space, the Max (Swatch 1) and STDev (Swatch 36/40) values are:


5D III (Red): 12282/10.5
D750 (Red): 13644/2.5


5D III (Green): 11300/5.8
D750 (Green): 12144/1.3


5D III (Blue): 12923/7.5
D750 (Blue): 12941/1.5


In terms of dynamic range, the formula when using digital numbers is 10 * log(Max/Stdev) * 3 (similar but slightly different to the formula when using electron charge) , which takes the maximum (saturation) over the standard deviation of noise (of a swatch where SNR reaches a ratio of ~1:1...I used the first swatch where the seam between it and the next swatch was not visible in each image, as every swatch after that looked the same (for some reason the PI statistics window doesn't actually directly report SNR, so this was my only real option)...this was swatch 36 for the 5D III, swatch 40 for the D750). I ran the above formula, and got the following:


5D III (Red): 10.22 stops
D750 (Red): 12.45 stops


5D III (Green): 10.96 stops
D750 (Green): 13.23 stops


5D III (Blue): 10.78 stops
D750 (Blue): 13.12 stops


The red channel in the D750 image is exposed a little bit more than the other two channels, and that seems to weight the noise, hence the reason that channel has 12.45 stops instead of 13.something. These numbers seem to be pretty in line with what I was expecting, given the exposure level of swatch 1 in both images.


To actually reach 13.7 stops of dynamic range, we need the maximum level to be 2^14 - offset. In a Canon camera, the bias offset is 2048. In a Nikon camera, the clipping offset is 600 (this is based on work by some guys at Nikon Hacker who figured out how to restore a bias offset to Nikon cameras for astrophotography purposes, which after the black point clipping was removed, resulted in a bias offset of 600). So, for the 5D III, the maximum level that can be reached in a given pixel is 14366. For the D750, it is 15784. At those levels, to reach 13.7 stops of DR, you would have to have read noise as low as 1.113 for the 5D III (not going to happen), and 1.23 for the D750 (well, it got as low as 1.3 in the green channel...so, maybe.)


Anyway, if we run the math with those numbers:


5D III (Max Stouffer DR): 10 * log(14366/1.11) * 3 = 13.7067 stops
D750 (Max Stouffer DR): 10 * log(15784/1.23) * 3 = 13.69437 stops


With maximum saturation numbers like 12282 and 13644, you are exposing WELL below the clipping point on swatch 1. Swatch 1 needs to be clipped, then swatch 2 would be used as the maximum saturation swatch, and whichever the first swatch where the seam between it and the next becomes invisible would be used for the standard deviation (SNR 1:1) swatch (this, at least, is the only way it could be done using PI statistics...I am honestly not sure which swatch is truly where SNR 1:1 would first occur...but I don't have any better way at the moment given the tools at my disposal, and once all the dark swatches reach a point where they all look the same and blend into each other, you HAVE reached the minimum usable level.). That is the only way to properly use the Stouffer T4110 Step Wedge. Otherwise you are under-utilizing it.


Based on the numbers above, your about two thirds of a stop or so under-exposed, which is fairly significant.
 
Upvote 0