UK pricing for the new Canon gear has leaked ahead of tomorrow’s announcement

Jul 21, 2010
31,202
13,073
BUT, the 24-105 at 100mm is not in the same league. Its image quality is good, but not even as good as the EF135. It's far worse than the 100-500 (at the wide end)
Did you test your RF 24-105/4 when you got it? My copy is very similar to my 100-500 at the wide end. The RF 100-400 is also similar at the wide end, but has more field curvature (meaning a center-focused shot is fairly soft in the corners compared to the L lenses, but if you focus the lenses in the corners the RF 100-400 is only very slightly less sharp).

IMO, a frequently ignored tradeoff with the less expensive lenses, including L-series lenses, is factory QC.
 
Upvote 0

AlanF

Desperately seeking birds
CR Pro
Aug 16, 2012
12,440
22,877
Did you test your RF 24-105/4 when you got it? My copy is very similar to my 100-500 at the wide end. The RF 100-400 is also similar at the wide end, but has more field curvature (meaning a center-focused shot is fairly soft in the corners compared to the L lenses, but if you focus the lenses in the corners the RF 100-400 is only very slightly less sharp).

IMO, a frequently ignored tradeoff with the less expensive lenses, including L-series lenses, is factory QC.
Opticallimits.com, one of the most reliable testers of lenses, much respected by Uncle Roger, raves about the RF 100-500mm at 100mm as being up to prime lens levels. https://opticallimits.com/canon_eos_ff/1102-canonrf100500f4571
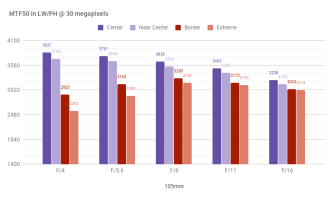
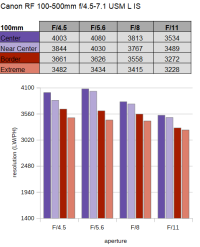
Here are their MTF results at 100mm. They are marginally better than the the RF 24-105mm at 100mm, but only by 4-5% in the centre and near centre and you wouldn't be able to see it in practice.

100-500mm_mtf_optical_limits.pngmtf_24_105mm_Optical_Limits.png

Copyright Opticallimits.com
 
  • Like
Reactions: 1 users
Upvote 0

SwissFrank

1N 3 1V 1Ds I II III R R5
Dec 9, 2018
526
360
Opticallimits.com, one of the most reliable testers of lenses, much respected by Uncle Roger, raves about the RF 100-500mm at 100mm as being up to prime lens levels. https://opticallimits.com/canon_eos_ff/1102-canonrf100500f4571
Here are their MTF results at 100mm. They are marginally better than the the RF 24-105mm at 100mm, but only by 4-5% in the centre and near centre and you wouldn't be able to see it in practice.

View attachment 207810View attachment 207811

Copyright Opticallimits.com
Thanks for digging this information out and posting here. It's great to have all the info in one place.

Personally I never really know what tests like this mean though. What does 3837, 2565, etc., LOOK like? On the tests I posted, the main thing is meant to be the images, that you can see clearly, of lines that are two pixels wide on an R5 sensor, about the finest detail you can actually photograph. (Any narrower feature would probably not be aligned with the sensor grid and thus spread between 2-4 pixels and therefore not sharp even if the lens were mathematical perfection.) Granted, I put scores on my images too, but they're meant to help you find images to compare by eye. For instance you might look at the numbers as a quick guide but then confirm their suggestion by actually looking at the 1:1 images.

Work is busy right now but I will post my 24-105 results to compare with the 100mac and 100-500. I can tell you now, though, that the 24-105, though I really like the lens, is not in the same league. If some other test is saying it's "only 5% difference," then I guess in that test it's a big 5%. Or maybe my example is bad, I dunno. "can you see it in practice" means a lot of different things. I shoot family photos and edit to 1500x1000 to look at on the screen, and print maybe 2 a year at much higher resolution. But I've done some photo projects that depend on full resolution (either huge prints, highly detailed prints, or massive cropping). So most of the time it doesn't matter at all. Sometimes it matters a huge amount. My test was meant to illustrate that but I'm not sure if it is making sense to people.
 
Upvote 0

AlanF

Desperately seeking birds
CR Pro
Aug 16, 2012
12,440
22,877
Thanks for digging this information out and posting here. It's great to have all the info in one place.

Personally I never really know what tests like this mean though. What does 3837, 2565, etc., LOOK like? On the tests I posted, the main thing is meant to be the images, that you can see clearly, of lines that are two pixels wide on an R5 sensor, about the finest detail you can actually photograph. (Any narrower feature would probably not be aligned with the sensor grid and thus spread between 2-4 pixels and therefore not sharp even if the lens were mathematical perfection.) Granted, I put scores on my images too, but they're meant to help you find images to compare by eye. For instance you might look at the numbers as a quick guide but then confirm their suggestion by actually looking at the 1:1 images.

Work is busy right now but I will post my 24-105 results to compare with the 100mac and 100-500. I can tell you now, though, that the 24-105, though I really like the lens, is not in the same league. If some other test is saying it's "only 5% difference," then I guess in that test it's a big 5%. Or maybe my example is bad, I dunno. "can you see it in practice" means a lot of different things. I shoot family photos and edit to 1500x1000 to look at on the screen, and print maybe 2 a year at much higher resolution. But I've done some photo projects that depend on full resolution (either huge prints, highly detailed prints, or massive cropping). So most of the time it doesn't matter at all. Sometimes it matters a huge amount. My test was meant to illustrate that but I'm not sure if it is making sense to people.
What you are looking at in your tests is resolution, which is what I usually do too - contrast can be sorted out more easily by sharpening. As a rough guide to what these numbers mean, and is important for what I do, resolving distant objects like birds feathers, I use the following. If say a lens has a resolving power of 3000 lp/mm and another one of the same focal length has 10% more at 3300 lp/mm, the better lens is giving 10% more resolution and to an approximation has an effective focal length of 10% more. You can stand 10% further away from the target and get the same resolution as the poorer lens.
 
  • Like
Reactions: 1 user
Upvote 0

SwissFrank

1N 3 1V 1Ds I II III R R5
Dec 9, 2018
526
360
What you are looking at in your tests is resolution, which is what I usually do too - contrast can be sorted out more easily by sharpening. As a rough guide to what these numbers mean, and is important for what I do, resolving distant objects like birds feathers, I use the following. If say a lens has a resolving power of 3000 lp/mm and another one of the same focal length has 10% more at 3300 lp/mm, the better lens is giving 10% more resolution and to an approximation has an effective focal length of 10% more. You can stand 10% further away from the target and get the same resolution as the poorer lens.
I take your point but just to be clear, the R5 only has 227 pixels per mm and even if you had a test pattern perfectly aligned with the sensor such that each line was illuminating exactly one row of pixels, the R5 can only see like 113 lp/mm. (half of 227.) And in practice it's utterly impossible that lines would be aligned so perfectly with the sensor. So, I test 55 lp/mm and that's the absolute maximum resolution I think we can talk about for Canon lenses of today. No higher figure really makes sense to discuss on a 45MP sensor.

> If say a lens has a resolving power of 3000 lp/mm and another one of the same focal length has 10% more at 3300 lp/mm, the better lens is giving 10% more resolution

It's not quite the case that lenses resolve details up to a certain point then don't. Instead everything's a grey area between "yes" and "no." MTF charts from manufacturers like Canon, and various testing sites, might graph that a given lens is "70% contrast" at "10 lp/mm" at the edge of a given lens, but what does 70% contrast even MEAN? I would wager that no-one on this forum even knows what this means in practice, unless they've worked professionally to create such charts. What's the dynamic range of the test chart they're using, what's the dynamic range of the sensor, etc. etc. It's all unclear. That's why my charts have actual cuts of the 1:1 detail in question, so you can see with your own eyes. NO-ONE looks at my chart and wonders what it would mean in practice. It's typical laser-printer paper with typical laser-printer black, with details exactly two pixels tall. People know this paper and know what two pixels are...
 
Upvote 0

AlanF

Desperately seeking birds
CR Pro
Aug 16, 2012
12,440
22,877
I take your point but just to be clear, the R5 only has 227 pixels per mm and even if you had a test pattern perfectly aligned with the sensor such that each line was illuminating exactly one row of pixels, the R5 can only see like 113 lp/mm. (half of 227.) And in practice it's utterly impossible that lines would be aligned so perfectly with the sensor. So, I test 55 lp/mm and that's the absolute maximum resolution I think we can talk about for Canon lenses of today. No higher figure really makes sense to discuss on a 45MP sensor.

> If say a lens has a resolving power of 3000 lp/mm and another one of the same focal length has 10% more at 3300 lp/mm, the better lens is giving 10% more resolution

It's not quite the case that lenses resolve details up to a certain point then don't. Instead everything's a grey area between "yes" and "no." MTF charts from manufacturers like Canon, and various testing sites, might graph that a given lens is "70% contrast" at "10 lp/mm" at the edge of a given lens, but what does 70% contrast even MEAN? I would wager that no-one on this forum even knows what this means in practice, unless they've worked professionally to create such charts. What's the dynamic range of the test chart they're using, what's the dynamic range of the sensor, etc. etc. It's all unclear. That's why my charts have actual cuts of the 1:1 detail in question, so you can see with your own eyes. NO-ONE looks at my chart and wonders what it would mean in practice. It's typical laser-printer paper with typical laser-printer black, with details exactly two pixels tall. People know this paper and know what two pixels are...
I have written a Geek thread on this:

There's a bit of cognitive dissonance between your two paragraphs where in the first you impose an absolute cut-off for the sensor and then have shades of gray for the lens. They are both in the same boat. The MTF where the human eye can't resolve objects of different luminance does vary according to conditions etc but is about 0.09 in the Rayleigh criterion for resolution, ie 0.09 = (Lmax - Lmin) / (Lmax + Lmin) where Lmax is the luminance at the peak and Lmin at the minimum. Your definition of "absolute" maximum resolution of a sensor is that there are no shades of gray as the lp/mm of the signal approach twice the pixels per mm of sensor but stops abruptly. There are shades of gray: the contrast drops as the signal frequency goes from being less than that of the sensor to higher, and resolution is lost when the contrast in the gray is 0.09 as defined by (Lmax - Lmin) / (Lmax + Lmin) from the luminance of neighbouring pixels. The equation for the MTF of a sensor is:
= sinc((pi*f)/(2*fNyq))
where fNyq = Nyquist frequency = 1/(2 pixel pitch).
I have plotted this in the thread.
This is what 70% contrast means in terms of Michelson Contrast or Modulation:
0.7 = (Lmax - Lmin) / (Lmax + Lmin), please send me your wager.

Lenses do have a cut-off: The limiting cut-off (f(c)) frequency is the spatial frequency at which contrast reaches zero
f(c) = 2NA/λ ~ 1/fλ, where NA is the numerical aperture and λ the wavelength.
 
  • Like
Reactions: 1 user
Upvote 0

SwissFrank

1N 3 1V 1Ds I II III R R5
Dec 9, 2018
526
360
I have written a Geek thread on this:

There's a bit of cognitive dissonance between your two paragraphs where in the first you impose an absolute cut-off for the sensor and then have shades of gray for the lens. They are both in the same boat. The MTF where the human eye can't resolve objects of different luminance does vary according to conditions etc but is about 0.09 in the Rayleigh criterion for resolution, ie 0.09 = (Lmax - Lmin) / (Lmax + Lmin) where Lmax is the luminance at the peak and Lmin at the minimum. Your definition of "absolute" maximum resolution of a sensor is that there are no shades of gray as the lp/mm of the signal approach twice the pixels per mm of sensor but stops abruptly. There are shades of gray: the contrast drops as the signal frequency goes from being less than that of the sensor to higher, and resolution is lost when the contrast in the gray is 0.09 as defined by (Lmax - Lmin) / (Lmax + Lmin) from the luminance of neighbouring pixels. The equation for the MTF of a sensor is:
= sin(/2)/(/2) = sinc(()/(2))
where fNyq = Nyquist frequency = 1/(2 pixel pitch).
I have plotted this in the thread.
This is what 70% contrast means in terms of Michelson Contrast or Modulation:
0.7 = (Lmax - Lmin) / (Lmax + Lmin), please send me your wager.

Lenses do have a cut-off: The limiting cut-off (f(c)) frequency is the spatial frequency at which contrast reaches zero
f(c) = 2NA/λ ~ 1/fλ, where NA is the numerical aperture and λ the wavelength.
Obviously you know this subject better than me, hat = doffed!

Still, my point is, what IS Lmax and Lmin in any given test? I've never seen an MTF chart that says. And what of the the sensor's dynamic range? On one sensor it may be 255 and 0, while on another 229 and 42. That's my point. In contrast my test is typical laser printer black on typical printer paper white in a domestic environment. And while I don't go into what the dark and light values are, I am distributing the target at 1:1 as a very high-quality JPG so the viewer can see for themselves what result they'd get on their monitor, with an R5 and the lens and shooting style in question...
 
Upvote 0

AlanF

Desperately seeking birds
CR Pro
Aug 16, 2012
12,440
22,877
Obviously you know this subject better than me, hat = doffed!

Still, my point is, what IS Lmax and Lmin in any given test? I've never seen an MTF chart that says. And what of the the sensor's dynamic range? On one sensor it may be 255 and 0, while on another 229 and 42. That's my point. In contrast my test is typical laser printer black on typical printer paper white in a domestic environment. And while I don't go into what the dark and light values are, I am distributing the target at 1:1 as a very high-quality JPG so the viewer can see for themselves what result they'd get on their monitor, with an R5 and the lens and shooting style in question...
Read this, I have written enough:
 
  • Like
Reactions: 1 users
Upvote 0
Jul 21, 2010
31,202
13,073
Work is busy right now but I will post my 24-105 results to compare with the 100mac and 100-500. I can tell you now, though, that the 24-105, though I really like the lens, is not in the same league. If some other test is saying it's "only 5% difference," then I guess in that test it's a big 5%. Or maybe my example is bad, I dunno.
That’s what I’m suggesting. According to various testing sites, the RF 24-105/4 and RF 100-500 are in the same league. My own experience aligns with that. Since yours does not, it's possible that your lens needs service.

NO-ONE looks at my chart and wonders what it would mean in practice. It's typical laser-printer paper with typical laser-printer black, with details exactly two pixels tall. People know this paper and know what two pixels are...
Your charts, like those of many at-home testers, are ‘typical laser-printer paper with typical laser-printer black’. Those more serious about it use photographic paper, which is how the charts from image testing vendors are printed. Charts from Imatest cost a few hundred dollars. The large size of the enhanced ISO-12233 type chart that Bryan/TDP and I use (Applied Image QA-77) costs more than the RF 24–105/4 lens.

I take your point but just to be clear, the R5 only has 227 pixels per mm and even if you had a test pattern perfectly aligned with the sensor such that each line was illuminating exactly one row of pixels, the R5 can only see like 113 lp/mm. (half of 227.) And in practice it's utterly impossible that lines would be aligned so perfectly with the sensor. So, I test 55 lp/mm and that's the absolute maximum resolution I think we can talk about for Canon lenses of today. No higher figure really makes sense to discuss on a 45MP sensor.
It seems like you're suggesting (and maybe I'm misinterpreting) that because the pixel dimensions of the R5 sensor are limited to 113 lp/mm, the resolution values published on opticalimits.com with values of thousands of lp/mm are meaningless. This may be the cognitive dissonance to which Alan is referring? You are talking about resolution in image space, what generally matters to photographers is resolution in object space. Another area where this comes into play is depth of field, which is an object space measurement; the corresponding image space measurement is depth of focus, and that's measured in µm distances in front of or behind the sensor, and is really only relevant to designers of AF systems.

Your point about the R5 sensor resolution being limited to 113 lp/mm would be relevant when shooting with a macro lens at 1:1 magnification, where 1 mm on the test chart equals 1 mm on the sensor. That's not how resolution is typically tested, though, except in the specific case of testing a macro lens at close focus. The whole point of a camera lens is that it takes what's out there in object space (i.e. the actual scene) and refracts the light from the entire field of view through multiple boundaries, so that a much larger physical area in the object space is projected onto the relatively small sensor in your camera. What is of interest is the ability of that system of lens and camera to resolve objects in the real world. In the case of lens testing, that means resolving lines on a test chart at spacings down to thousands of lines per mm.

I know this sounds a bit harsh, but while it's great that you are doing all these tests and sharing your results, if you don't understand the principles behind what you're testing it's hard to view your results as anything more than anecdotes.
 
Upvote 0

SwissFrank

1N 3 1V 1Ds I II III R R5
Dec 9, 2018
526
360
Read this, I have written enough:
Clearly you know the subject well but this article is making the same mistake I am talking about: "telling us everything but showing us nothing." We can read this article word for word and when we're finished, who will have any idea what a contrast of 0.7 means in terms of art, reportage, and family memories?

I don't know if I'm accomplishing my goal at all, but what I want to do is show people what to expect in a real-world output file from photos shot in real-world conditions. I'm showing that the contrast on familiar laser printer print-outs in familiar domestic lighting looks like THIS: here is the 1:1. This lens can get THIS detail at this shutter speed, about this percent of the time. At a different shutter speed, sorry, but be prepared for the image looking as bad as this. Most people don't know or care whether what they're looking there is 0.99 or 0.66 or 0.33 on a transfer function. Some people are more interested in the resolution they can expect for their $7000 purchase than what the theoretical result of a test on an optic bench might be. Others may enjoy the math more, but they're amply catered to already.
 
Upvote 0

Michael Clark

Now we see through a glass, darkly...
Apr 5, 2016
4,722
2,655
I take your point but just to be clear, the R5 only has 227 pixels per mm and even if you had a test pattern perfectly aligned with the sensor such that each line was illuminating exactly one row of pixels, the R5 can only see like 113 lp/mm. (half of 227.)

The numbers on the sides of those charts AlanF shared above appear to be lines-per-image height, not line pairs-per-millimeter.

(LW/PH) = Line Widths/Picture Height

Divide by two to get (LP/PH) = Line Pairs/Picture Height.

Divide by the sensor height in millimeters to convert (LP/PH) to (LP/mm).

113 LP/mm * 2 (LW/LP) * 24 (mm sensor height) = 5,424. This is your theoretical 113 lp/mm max resolution expressed in (LW/PH).
 
Last edited:
  • Like
Reactions: 1 users
Upvote 0

SwissFrank

1N 3 1V 1Ds I II III R R5
Dec 9, 2018
526
360
The numbers on the sides of those charts AlanF shared above appear to be lines-per-image height, not line pairs-per-millimeter.

(LW/PH) = Line Widths/Picture Height

Divide by two to get (LP/PH) = Line Pairs/Picture Height.

Divide by the sensor height in millimeters to convert (LP/PH) to (LP/mm).

113 LP/mm * 2 (LW/LP) * 24 (mm sensor height) = 5,424. This is your theoretical 113 lp/mm max resolution expressed in (LW/PH).
that makes sense. He did say "3000 lp/mm" but could easily have been a typo.

Still my curiosity is what expectations to have and how to get the most out of the physical hardware, not a theoretical analysis.
 
Upvote 0

AlanF

Desperately seeking birds
CR Pro
Aug 16, 2012
12,440
22,877
that makes sense. He did say "3000 lp/mm" but could easily have been a typo.

Still my curiosity is what expectations to have and how to get the most out of the physical hardware, not a theoretical analysis.
That 3000 lp/mm was just used as an illustration for arithmetical purposes and didn't refer to any chart or sensor.
 
  • Like
Reactions: 1 user
Upvote 0

Michael Clark

Now we see through a glass, darkly...
Apr 5, 2016
4,722
2,655
that makes sense. He did say "3000 lp/mm" but could easily have been a typo.

Still my curiosity is what expectations to have and how to get the most out of the physical hardware, not a theoretical analysis.

None, and I do mean NONE of the lenses we discuss here (RF, EF, E, F, Z, etc.) remotely approach anywhere near 3,000 lp/mm.

3,000 lp/mm would equate to 144,000 (LW/PH) on a FF sensor in landscape orientation. It would take roughly 31,104 megapixels for a 3:2 36mmx24mm sensor to exploit that kind of resolution.
 
Upvote 0
Jul 21, 2010
31,202
13,073
3000 lp/mm is, of course, impossible for a dry lens and visible wavelength light.
Careful saying ‘impossible’. When I started doing fluorescence microscopy, the diffraction (Abbe) limit was a hard line for optical imaging. Today, there are turnkey systems that deliver >5-times better resolution than that (sub 50 nm) with fluorophores that absorb and emit light in the visible wavelength range.

It’s pretty cool imaging structures optically that I used to need electron microscopy to resolve.
 
  • Like
Reactions: 1 user
Upvote 0

AlanF

Desperately seeking birds
CR Pro
Aug 16, 2012
12,440
22,877
3000 lp/mm is, of course, impossible for a dry lens and visible wavelength light.
As @neuroanatomist writes, be careful in saying impossible. Using the standard formula (10^6)/(f/#)×λ) for the cut-off frequency for resolution in lp/mm and the wavelength λ of 520nm usually used in the calculation, an f/0.95 lens has a theoretical diffraction-limited resolution of 2025 lp/mm.
According to Wikipedia, there are the following lenses:
  • GOI CV 20mm f/0.5 Mirror lens (2.9 mm image diameter, 1948; design and glass types used are well documented for anyone wanting to build their own
  • Signal Corps Engineering 33mm f/0.6[12]
  • GOI Iskra-3 72mm f/0.65 Mirror lens
which give theoretical diffraction limited resolutions of 3848, 3206 and 2960 lp/mm respectively. Zeiss made as a macho joke an f/0.33 40mm lens, which could have given a resolution of 5800 lp/mm. If the Military needs a 3000 lp/mm resolution lens, they will make one. I wonder what was carried by the shot down Chinese "weather balloon"? A 3000 lp/mm resolution lens may have been there...
 
Last edited:
Upvote 0