It’s time to fill those memory cards. Canon releases firmware v1.8.1 for the Canon EOS R5. 400mp stills are now possible

usern4cr

R5
CR Pro
Sep 2, 2018
1,376
2,308
Kentucky, USA
OK, I've increased the film-plane to subject distance to 3.19m so that my test chart is much smaller and thus has more resolution as far as it is viewed on the sensor. The finer resolution will mean that my test chart should no longer be the limiting factor in getting a "lines per image height" in my measurments. I have an R5 with RF 85 f1.2L. All images are taken in my basement garage with side door open for only natural diffuse lighting, on a good tripod and wired remote button. To align the test chart to the camera first aim the center of the camera at the center of the chart. Then I put a laser distance measure with a flat back lightly against the chart at the center of the chart. I adjust the angles of the chart until the laser line hits the center of the lens hood (well, pretty darn close for me).

I use ISO 400 and either f2 or f2.8, normally for the normal 45M image as well as the 400M pixel-shift used. All photos taken one after the other with the identical settings between them. The 45M versions I do run through DXO Photolab to get a clean output. I always do that with all my files. I haven't touched anything else. The 400M files are jpg so I haven't touched them at all (except for cropping small parts to see).

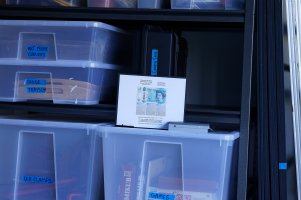
This is what the camera & lens see in all the images. Here is a full 45M 8K wide (uncropped) image taken, reduced to 2K wide to upload:
A07_1931_1_98%.jpg


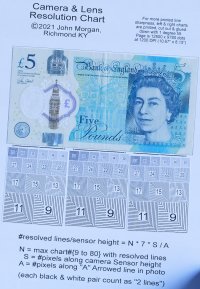
Cropping in that 45M photo to just show the printed test chart area gives us this (UNCROPPED, 1:1) image at f2.8
A07_1931_2_98%.jpg


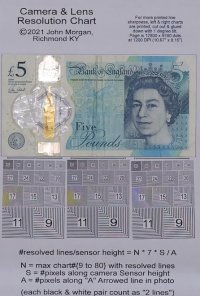
Now I'm going to show the 400M image, but it's cropped to a 2Kx2K size (for uploading) of the ORIGINAL 1:1 pixels from the 400M jpg:
A07_1934_2_98%.jpg


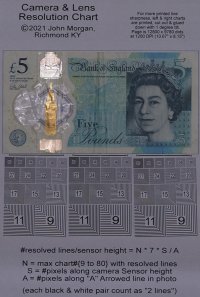
I will show a crop of this same area (original 1:1 pixels) from the 45M image. Note that it is a much smaller in pixel size:
A07_1931_4_98%.jpg


Now I will upres this normal 45M crop to a 3x3 larger image, using DXO Photolab smoothing. This helps in comparisons with previous images.
A07_1931_4_98%_98%_3x3X.jpg


It is now possible (well, to me hopefully) to show (roughly) what the "#lines per sensor image height" value is
for my R5 & lens in 45M mode and in 400M mode!
I'm looking for the highest number where the lines can be resolved from each other with a reasonable quality
Well, reasonable is really a value judgement as I don't "full width half-height" measurements or things like that.
Note that a white line and black line pair count as "2 lines".

45M Resolution:
*EDIT*
I've adjusted some of the number I've picked.
I now pick 22 for vertical and horizontal resolution. What #'s would you pick?
I measure the length of the "A" line in the image as ~232 pixels. The 45M sensor has a 5464 pixel image height.
Plug this in with N * 7 * S / A

45M resolution estimate:
Vertical & horizontal resolution: 22 * 7 * 5464 / 232 = ~3600 lines per sensor image height

This is frickin' amazing since just ~3 pixels can sense a transition from white to black to white,
where 5464 / 3(pixels) * 2(white & black lines) = 3643 lines.


400M Resolution:
Vertical resolution # of 48, and horizontal resolution # of 40.
Note: you may decide of different #s based on how clearly defined you think the lines have to be.
There seems to be more vertical resolution than horizontal.
"A" measured at 697 pixels, sensor image height = 16384 so:

400M resolution estimate:
Vertical resolution: 48 * 7 * 16384 / 697 = ~7900 lines per sensor image height.
Horizontal resolution: 40 * 7 * 16384 / 697 = ~6600 lines per sensor image height.

And for that, I now say, AWESOME CANON! -- HUZZAH!
 
Last edited:
  • Like
  • Wow
Reactions: 11 users
Upvote 0

Steve Balcombe

Too much gear
Aug 1, 2014
283
223
The output is JPG. To suggest that a JPG should only be viewed in DPP is silly.
Yes, it's really silly, but they say that's how it should be done, but there's no helping it. We will probably have an update for the previous update coming soon, as we have many times before.
I think the point you may be missing here is that this is standard practice for Canon - tell people to use your products, never mention other options regardless of how much confusion it causes. A JPEG is a JPEG, it doesn't require special software to open.

This very much reminds me of the FUD surrounding USB charging for [whichever was the first body to get it, I forget] when Canon insisted you had to buy their ludicrously overpriced PD-E1 charger. A few of us who were technically aware just looked up the spec and immediately realised all you needed was a PD charger - or more importantly for many, a power bank - capable of delivering 9V 3A. In practice that means any 30W PD charger, but always check the small print just in case.

Canon has managed to extend this isolationist policy to spreading confusion about using their free software for their free firmware update!
 
Last edited:
  • Like
Reactions: 4 users
Upvote 0

Del Paso

M3 Singlestroke
CR Pro
Aug 9, 2018
3,357
4,266
OK, I've increased the film-plane to subject distance to 3.19m so that my test chart is much smaller and thus has more resolution as far as it is viewed on the sensor. The finer resolution will mean that my test chart should no longer be the limiting factor in getting a "lines per image height" in my measurments. I have an R5 with RF 85 f1.2L. All images are taken in my basement garage with side door open for only natural diffuse lighting, on a good tripod and wired remote button. To align the test chart to the camera first aim the center of the camera at the center of the chart. Then I put a laser distance measure with a flat back lightly against the chart at the center of the chart. I adjust the angles of the chart until the laser line hits the center of the lens hood (well, pretty darn close for me).

I use ISO 400 and either f2 or f2.8, normally for the normal 45M image as well as the 400M pixel-shift used. All photos taken one after the other with the identical settings between them. The 45M versions I do run through DXO Photolab to get a clean output. I always do that with all my files. I haven't touched anything else. The 400M files are jpg so I haven't touched them at all (except for cropping small parts to see).

This is what the camera & lens see in all the images. Here is a full 45M 8K wide (uncropped) image taken, reduced to 2K wide to upload:
View attachment 208242


Cropping in that 45M photo to just show the printed test chart area gives us this (UNCROPPED, 1:1) image at f2.8
View attachment 208243


Now I'm going to show the 400M image, but it's cropped to a 2Kx2K size (for uploading) of the ORIGINAL 1:1 pixels from the 400M jpg:
View attachment 208253


I will show a crop of this same area (original 1:1 pixels) from the 45M image. Note that it is a much smaller in pixel size:
View attachment 208254


Now I will upres this normal 45M crop to a 3x3 larger image, using DSO Photolab smoothing. This helps in comparisons with previous images.
View attachment 208255


It is now possible (well, to me hopefully) to show what the "#lines per sensor image height" value is for my R5 & lens in 45M mode and in 400M mode! I look at the 45M chart and see that the most it can resolve is the number "22" on the chart (what do you think?) (And hmmm, the 3X upres'd version might use the "24" number - interesting!) Go ahead, what number would you pick?

I measure the length of the "A" line in the image as ~232 pixels. The 45M sensor has a 5464 pixel image height. Plug this in with N * 7 * S / A as: 22 * 7 * 5464 pixel height / 232 = (drum roll ... ) ~3,600 lines of resolution in the sensor height! Note that a white line and black line pair count as "2 lines". This is frickin' amazing since just 3 pixels can sense a transition from white to black to white even with those lines overlapping on the sensors as they are in this tilted viewing.

Now to solve the equation for the 400M image, I get:
(Ok, another even longer drum roll ... roll ...)
N = 40 (OK, OK, look for yourself and see if you agree!?), "A" measured at 697 pixels, sensor image height = 16384 so:
(another drum roll ... )
40 * 7 * 16384 / 697 = ~6,600 lines per sensor image height!!!

So, if what I have seen is remotely correct (hmmm), the 45M file has ~3600 lines and the 400M version has ~6600 lines (blk & wht = 2 lines) of resolution per sensor image height on the same R5 sensor in it's old 45M and new 400M mode.

And for that, I now say, AWESOME CANON! -- HUZZAH!
I hope this puts an end to all the whining...:)
 
  • Like
Reactions: 7 users
Upvote 0

usern4cr

R5
CR Pro
Sep 2, 2018
1,376
2,308
Kentucky, USA
That's a seriously impressive result usern4cr!!

And, yes, I see N=40 as properly resolved in the 400M image.

So, within its limitations on practical usability, the function absolutely does work.
Thank, Jethro!

As I looked at my 45M 1:1 images again, one might say that the R5 did get close to the "24" for resolving (barely). If I put that number in I get a value of ~3900 lines of resolution. Now I happen to have a page printed out (from some reliable site a few years ago) on the RF 80 f1.2L (as well as others) and it says that it's peak measured lines / sensor image height is 4271 at f2 and 4162 at f2.8 in center. So it looks like my measurements (with much less precision) seem to be within reason relative to what they showed.

Also, if you're only interested in vertical resolution (and not horizontal), the 400M crop showed it could clearly reach the 48 number and almost reach the 60 number. If I moved the chart further away we could probably get a more accurate #. But if you put in a # of ~54 (as a guess half way between) that would make it come out to ~8900 lines vertically! Now I might try moving it further away to see if I can get a better number for it, and also rotate my chart 90 degrees to see if the chart itself being rotated makes any difference (hopefully not much). It would be nice to get a better feel for the vertical & horizontal resolutions, which might be close but might be more different than we expect. If different, it would only be because of the imperfections of the chart, sensor & software, and not because of the axially identical (rotational) quality of the lens. So my guess is that the 80 f1.2L lens can probably get to 9000 vertical lines and probably beyond with better sensors & test charts.
 
Last edited:
  • Like
Reactions: 1 user
Upvote 0
Jul 21, 2010
31,174
13,011
Disappointing to see it\'s a JPG, surely the world of R5 users are all RAW shooters... I\'ve not used JPG since my 350D!
Because of the way Canon implemented pixel shift (a 3x3 array of 1/3-pixel shifts), it would actually be possible to generate RAW output...but they'd be really big files! Canon is pretty conservative, and my guess is that they wouldn't want DPP crashing on systems with insufficient RAM to handle files of that size.
 
  • Like
Reactions: 1 users
Upvote 0

usern4cr

R5
CR Pro
Sep 2, 2018
1,376
2,308
Kentucky, USA
OK, I've moved my Lens Test Chart further away, to 5.9m to make it smaller with more apparent resolution to see just how high the 400M results (and 45M ones) get in this test setup. All shots are identical, taken in quick succession with no changes. The 45M ones have been output by PhotoLab for their Deep Prime noise reduction output, as I do with all my normal 45M raw work. I used f2.5, 400 ISO and -1.5 EV exposure to reduce the blow-out of the metal parts embedded in the 5 Pound note, in a darker room.

Here is a 2K wide reduced (for upload) view of the 45M view, uncropped, just as the camera sees it in all shots:
A07_1949_1_98%_45M_orig.jpg

Next I'll show a 1:1 pixel crop of the above 45M test chart:
A07_1949_2_98%_45M1x1.jpg


Next I'll show the same 1:1 crop of the 400M image:
A07_1950_2_98%_400M1x1.jpg


First I'm going to look at just the *vertical* resolution (ignoring the horizontal values) in the 45 and 400M images.
In the 45M image, I thought it could resolve "11" well (enough), and "almost 13, but not quite".
I measured the length of A in it as 124 pixels. The R5 sensor height is 5464.
So N * 7 * S / A becomes 11 * 7 * 5464 / 124 = ~3400 (vertically).
My guess is that it probably would have resolved a #12 chart if it were there.
If it did then the result would go up to ~3700 (so that's my guess for it).

In the 400M image, I thought the best it could do vertically is the 24, although 27 was close.
I measured the length of A in it as 372 pixels. The 800M image height is 16384
So N * 7 * S / A becomes 24 * 7 * 16384 / 372 = ~7400 (vertically).
My guess is that it would probably be OK at 25 (1/3 of the way to the 27),
which would change it to up to ~7700 (so that's my guess for it)

Now I'll check the *horizontal* resolution in the 45M image:
(I want values identical to the vertical ones, so use 5464 pixel height to make the results directly comparable)
My guess is that 11 would be OK, and it would probably work at 12.
Note: I really should have a vertical A line (called a B line? ), so I'll assume this A is accurate (enough).
Since these are the same #'s as vertical, it looks like an equal resolution either way (as far as I can tell).

On the 400M, I think 20 is the # for the horizontal resolution, which is less than the 25 vertically I thought was right.
That would go down to 20 * 7 * 16384 / 372 = ~6600 (horizontally) instead of 7700.
I'm guessing it's probably a limitation of my chart, either in accuracy of sharp tiny lines, or the aspect ratio of the chart printing is slightly off of 1:1.
I thought that if my chart was slightly off relative to the horizontal/vertical printing or aspect ratio,
that if I rotated the chart 90 degrees and retested everything, it might tell me if I had an error
(which might be see if the quality of the lines is reversed with a reversed chart).
So I did take another set of 45M and 400M photos with a vertically rotated chart (the camera didn't change).
That'll be the next post I'll show.
 
Last edited:
  • Like
Reactions: 1 user
Upvote 0

usern4cr

R5
CR Pro
Sep 2, 2018
1,376
2,308
Kentucky, USA
OK, now I'll do the same images, only with the lens test chart rotated 90 degrees to see what we get.

Here is the 45M entire (uncropped) portrait mode image, reduced to 2K to upload:

A07_1947_1_98%_45M_origVert.jpg


Here is the 1:1 crop from the above 45M vertical chart:
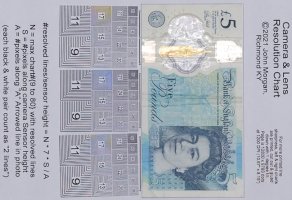
A07_1947_2_98%_45M1x1_vert.jpg


Here is the 1:1 crop from the 400M vertical chart:
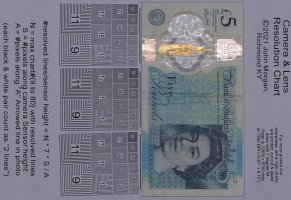
A07_1948_2_98%_400M1x1_vert.jpg


For the vertical 45M image, I see the vertical and horizontal resolution to be 11,
just like on the non-rotated image previously posted.
I read the value of A to be 123, which is within a percent of the 124 read in the normal mode,
so that means my chart aspect ratio is indeed 1:1.

For the vertical 400M image, I see the vertical resolution at 27, and horizontal resolution at 20.
Verrrrry interesting. It seems to me that the vertical resolution of the sensor is significantly higher than the horizontal resolution.
The first (non-rotated chart) showed vertical vs.horizontal resolution # of 24 vs 20, while the rotated chart images
show it as 27 vs 20.
A was 370, and the sensor image height is 16384.
vertical resolution: 27 * 7 * 16384 / 370 = 8400
horizontal resolution: 20 * 7 * 16384 / 370 = 6200

Obviously it's hard to get a perfect guess as the right #'s for me.
Based on this, I don't think the vertical vs horizontal difference is because of the sharpness and contrast of my lines.
But it may be that my chart printout is off a bit (in the printer itself).
I see the A value as 370, close to the 372 in the normal mode, so I'm leaning more to thinking my testChart is not the problem.

So, I've now got 3 different measures of the 45M resolution, at 2 different distances & 1 vertical rotation:
3600, 3400, 3400. So I'll guess that 3500 is a good estimate for 45M resolution for this test.

I've also got 3 measures of the 400M resolutions.
Vertical resolution: 7900, 7400, 7400, so I guess 7600 is a good estimate for this test.
Horizontal resolution: 6600, 6200, 6200, so I guess 6400 is a good estimate for this test.

I, for one, would be interested to see if anyone else can measure the vertical & horizontal 45M & 400M resolutions
and see if they get the same values or a noticeable increase the vertical one over the horizontal one.

The bottom line is that it shows a massive jump in line resolution over the 45M file,
and for that l give Cannon a big shout out, ... HUZZAH!
 
Last edited:
  • Like
Reactions: 1 users
Upvote 0

usern4cr

R5
CR Pro
Sep 2, 2018
1,376
2,308
Kentucky, USA
The peculiarity of the anti-aliasing filter, most likely.
Maybe.

It's interesting that I don't notice a vertical vs horizontal difference on the 45M file. If that made me guess further (hmmm), I'd say it might not be an issue with the R5 sensor, but maybe an issue with the pixel-shift firmware and hardware having an unavoidable difference that give extra perceived resolution to the vertical resolution vs the horizontal one.
 
Last edited:
Upvote 0

koenkooi

CR Pro
Feb 25, 2015
3,611
4,190
The Netherlands
  • Like
Reactions: 1 users
Upvote 0

fr34k

Canon R5 and lots of RF glass
Jul 16, 2022
67
80
Feel free to analyse this image of the real world to your heart's content. This one is taken without pouring concrete or using sandbags.
The wind was blowing very, very slightly, I was using a super small tripod and didn't extend legs and used my phone as a remote trigger. It is completely unaltered.

Here is a reference shot: (note: I'm using HDR PQ in RAW, so you might need to adjust your usual settings when developing)

EDIT: a second pair:

and

 
Last edited:
  • Like
Reactions: 2 users
Upvote 0