Mark D5 TEAM II
Proud N0ink 0wnz0r / crApple iFruitcake H4t3r
Thanks, just checked on TDP, it is the 2nd to use dual nano USM.I think the 70-200 is also dual nano USM.
Upvote
0
Thanks, just checked on TDP, it is the 2nd to use dual nano USM.I think the 70-200 is also dual nano USM.
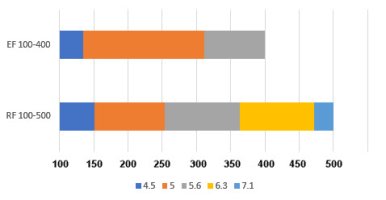
I hope that Laing's sample was an early pre-production model that got adjusted in the release model.Hate to burst your bubble, but have a look at Gordon's preview:View attachment 191207
I'm actually excited about the 100-500. Yes, it is expensive, but there is a premium paid for compact size and the best, fastest AF available.Really to expensive...
But sweet weight! With those technologies they could build much more nice lenses!
lets hope for some nice new 2.8 & 4.0f lenses >300mm!! How about a lightweight 800 8.0 DO. Would be a winner^^. Or a small 200-400 4.0 with 1.4tc
The other supertelephoto zooms I use have discrete jumps of f-number rather than smooth changes. If it was f/5.6 at 400mm, it would show f/5.6 at 400mm. Not that it worries me much if it is f/6.3 at 400mm rather than f/5.6. (I was about to upload the same screenshot!) By the way, the weight of the lens with tripod ring attached is 1.525 kg, only only 130 g less than the 100-400mm II, not 200 g as he says in the review.I'm assuming they represent the number that shows up in the EVF, which tends to be in 1/3 stops.
f/5.6 @ 400 mm was just confirmed in the "REIMAGINE - A Canon Premiere".
Okay?!Hate to burst your bubble, but have a look at Gordon's preview: ...
I'm convinced. Figures like the one shown by Cameralabs have been prepared by the Canon tech people. Where are the mtfs?Okay?!
Would be funny, if the ambassadors and tech people in the official (!) Canon "REIMAGINE" show don't tell the truth, but time will tell when other reviews come...
I am open to be convinced...
This is probably the best I've seen for a lens to keep the wider aperture throughout it's range. Normally zoom lenses quickly stop down to the smallest aperture so fast that the wide aperture value hardly matters. But this really keeps a good wide aperture far into the telephoto range - much more than I'd ever expect.

