StatisticsRule said:
(As a side note, you might argue I did not use Poisson statistics, but by the time you make the mean value large enough so the data does not show discrete height steps, the poisson distribution is essentially the same as a normal distribution.)
First off, I agree with this.
StatisticsRule said:
jrista said:
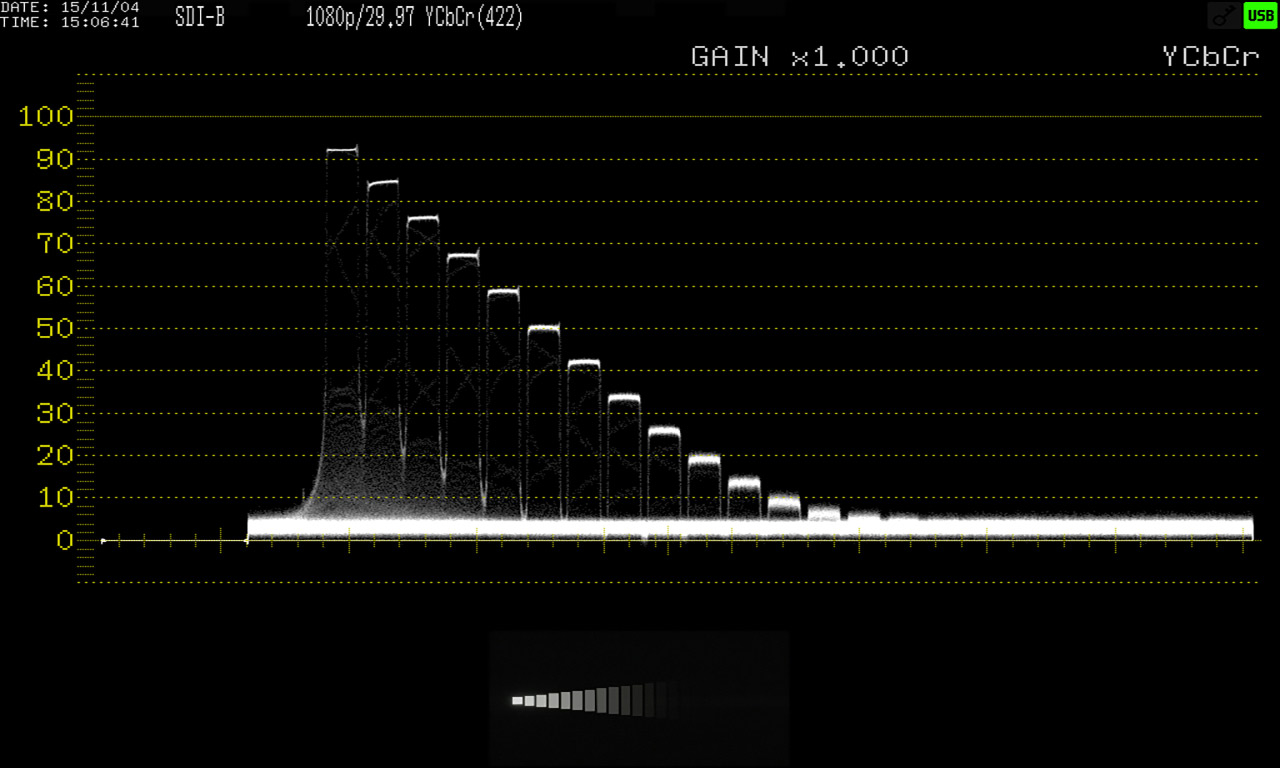
The white band at the top of each strip IS noise. It's the noise intrinsic to the signal itself...the shot noise. The way I believe Cinema5D evaluated that plot is that given the last two stops have no separation between the noise in the signal and the read noise, it's all noise. So SNR would not be >0dB for those last two stops. The 13th stop had a very small amount of separation between the two, so it was the first stop with >0dB SNR.
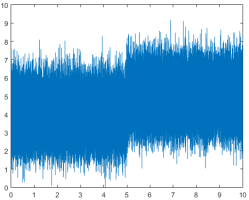
jrista, thank you for explaining how you got the negative dB estimate. I have to agree with others that the band separation is not the important point though. To help explain, I created some random data in MATLAB. When the x-axis is between zero and 5, the signal is exactly 0. Between 5 and 10, the signal is exactly 1. On top of that signal, I add 100,000 points of normal random distributed noise with std dev = 1. Finally, to look similar to Canon's plot, I offset all the data by 4 units.
I'd say the data is a reasonable approximation (qualitatively) to Canon's data for the high DR values. Most importantly, because I created the data, I know the right-half of the data has exactly SNR = 1 by definition of the signal height and the noise statistics. You can see the separation between steps is much smaller than the noise height.
From the crude MATLAB approximation here and the screenshot from Canon, I personally still believe Canon shows at least 14+ stops DR. Of course there is only so much you can get from a screenshot.
Is your signal just representative of shot noise, or does it also factor in read noise? Based on Canon's plot, it appears that signal starts at the zero line (you can see the bits of shot noise between each band reaching down all the way to the zero line in the graph in a few places, below the band of read noise). I believe it is only the read noise band that is actually offset from 0 by about 4 units. If you remove read noise from the plot, stops 14 and 15 would indeed have separation of the shot noise above the zero line, and the snr would be > 0dB. However with read noise added in, I do not believe that remains the case.
That is not to say there isn't any signal...of course there is signal...it's just that the signal is buried in the noise, SNR <1. If we are talking single-shot imaging, particularly with the CHARACTERISTIC of that noise (see the image below), I don't think those last two stops are very usable by any means (maybe if your doing non-artistic work...police photography of a crime scene or something):
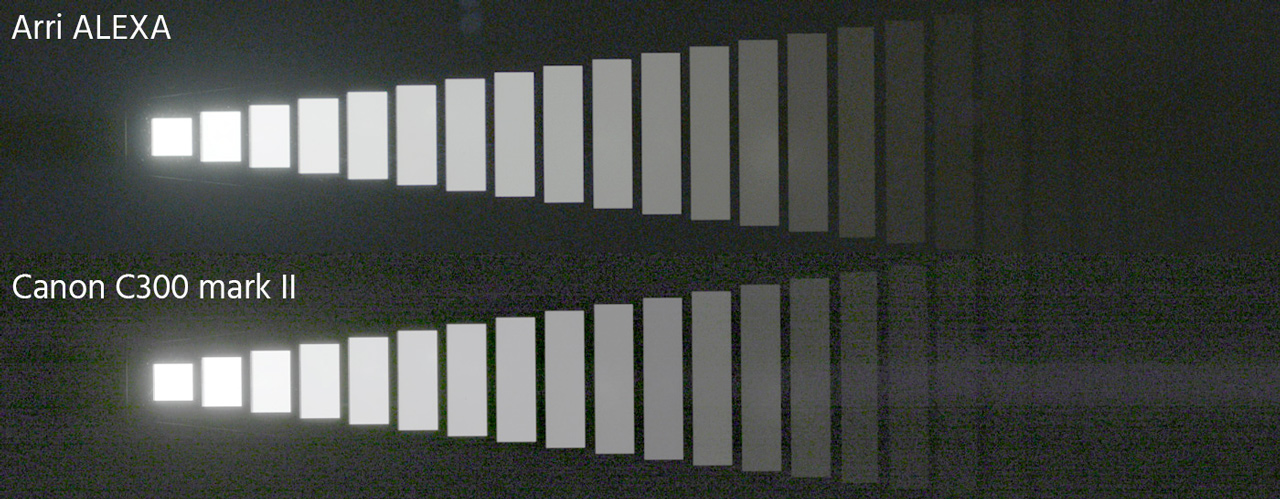
The Canon image has a purple band running right up through stop 12, and a good deal of banding running through stop 13 and up. The Arri, on the other hand, has very clean noise up through stop 18. Those upper stops on the Arri are undoubtedly no better, in terms of SNR, than Canon's stops 14 and 15...they are likely less than SNR 1, however they are much more usable. Similar to an Exmor sensor...you can easily dig very deep into the noise floor and pull out usable information, which is not the case with Canon data (about a seven stop or so lift here, well beyond what should be possible with either camera, but the A7r held up extremely well regardless; top row is just the shadow push, bottom row included additional processing to restore some aesthetic appeal, as much as was possible, to each image):

I also wonder what the power of those bands, particularly that purple band, is in Canon's data. I don't think a simple 2D slice of the signal is sufficient to explain how far those bands may protrude into the signal...and since the purple band is visible at least at stop 12, it's certainly more powerful than the signal at higher stops.
Now, if we are talking astrophotography, we have the option of stacking to reduce noise. Stack 4 subs and you'll reduce the noise by half. That would undoubtedly improve the SNR over 1 in stop 14. Stack 16 subs and it'll probably make stop 15 viable. Stack 64 subs, and your probably good across the board. That isn't going to help much with sports photography or anything like that, though.
") Your Matlab example makes me wish I had it, as I think it would make demonstrating what I try to explain with just math and formulas easier at times.
Your Matlab example makes me wish I had it, as I think it would make demonstrating what I try to explain with just math and formulas easier at times.